How do I understand the results of an audiogram?

Have you recently had a hearing test, or will you soon? Find out how to understand the results of your audiogram so you can make informed decisions about your hearing health. In this article, we'll walk you through the key elements of an audiogram and what they mean for your hearing.
What is an audiogram?
An audiogram is a graphical representation of a person's hearing ability. In other words, the audiogram represents the results of a hearing screening test. It measures the ear's response to different sound frequencies and intensity levels. The horizontal axis represents the frequencies, ranging from low frequencies on the left to high frequencies on the right, while the vertical axis represents the strength of the sound, ranging from very soft to very loud.
- Low frequencies are generally associated with bass sounds, such as engine noise.
- Hearing loss in the mid-frequency range can make it difficult to understand speech, especially in noisy environments.
- High frequencies represent high-pitched sounds, such as the sound of a doorbell or the voice of a young child.
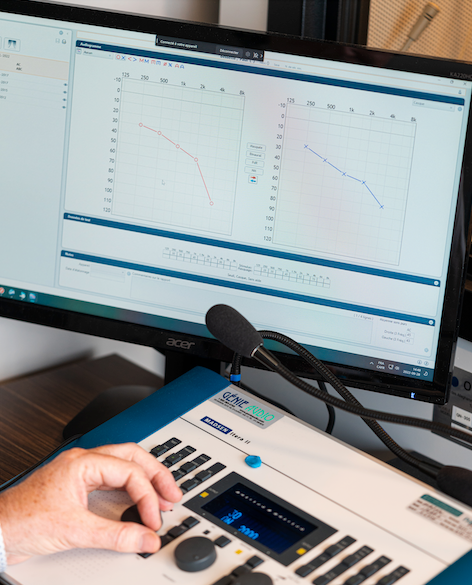
How to read an audiogram
The lines on the graph represent the level of loudness required to hear each frequency. The lowest line you can hear is called your hearing threshold. If your results fall within the normal range, your hearing threshold is within the normal range for each frequency, which means there is no hearing loss.
If your results show curves below normal, this indicates a hearing loss. In fact, the audiogram results will be presented to you in detail by your hearing care professional, who will then be able to offer you the best solutions adapted to your needs.
To find out more, watch this information capsule.
Don't hesitate to appointment with us!